Visual settings (2D)
This page lists all settings applicable to 2D visual objects. To adjust a particular object’s settings, use the AdjustVisual function and specify a reference to the object.
See Visual settings (3D) for the settings applicable to 3D visual objects.
Table of contents
Diagrams
-
Axes
-
Axis collections
-
Grid line families
-
Grid line family collections
-
Views
-
Diagrams
Objects
-
Bar charts
-
Pie charts
-
Legends
-
Categories
-
Histograms
-
XY plots (scatter plots, line charts, area charts)
-
Vector fields
-
Heat maps (scalar fields)
-
Text boxes
-
Line segments
-
Line endings
-
Rectangles
-
Circles and disks
-
Polygons
-
Pixmaps
Common
-
Metadata
-
Window size
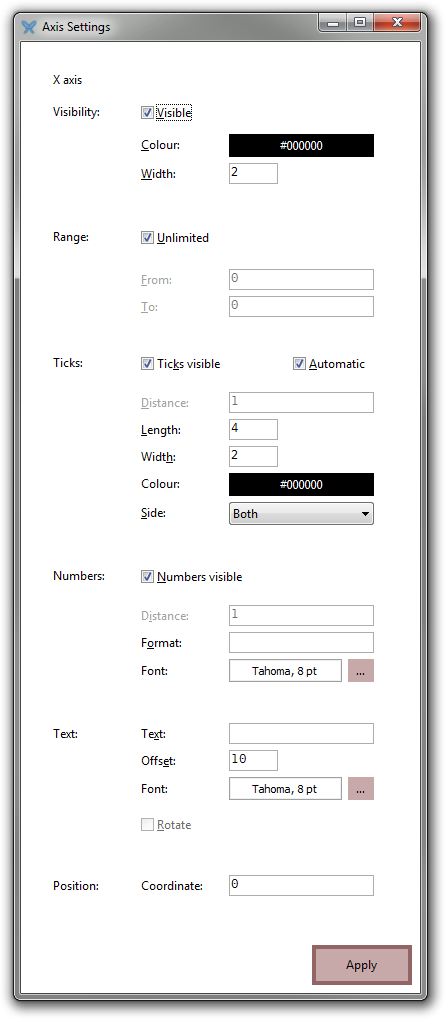
Axes
Each axis has the following properties:
-
automatic: boolean -
color: colour -
axmin: real number -
axmax: real number -
number distance: positive number -
number format: string -
numbers visible: boolean -
position: real number (the position of this axis along the opposite axis) -
width: real number -
text offset: real number -
tick distance: positive number -
tick length: positive integer -
tick width: positive integer -
tick color: colour -
ticks visible: boolean -
visible: boolean
A vertical axis has the following additional properties:
-
rotate text: boolean (iftrue, its label, if present, will be rotated 90°)
If d is a reference to a diagram, then d.axes.x is a reference to its horizontal axis and d.axes.y a reference to its vertical axis.
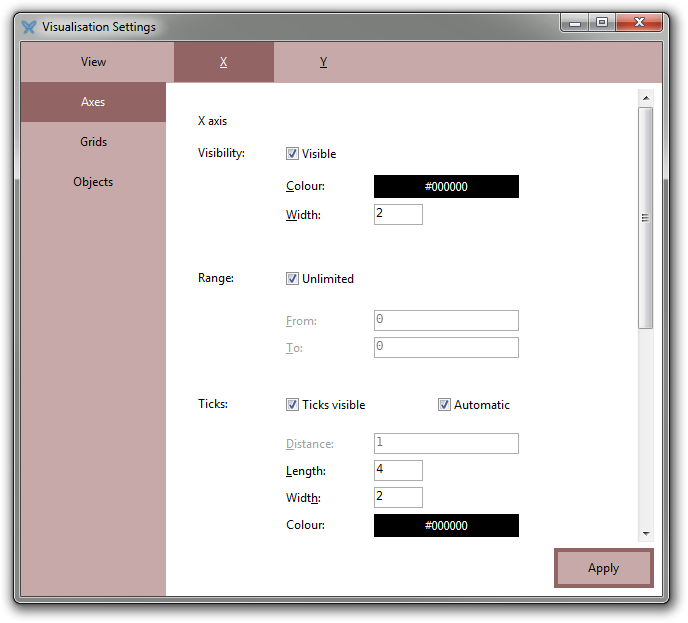
Graphical user interface:
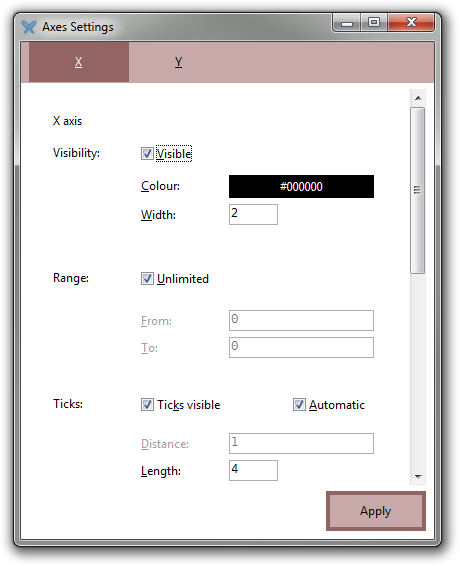
Axis collections
An axis collection has no properties of its own, but contains subreferences to the individual axes. If d is a reference to a diagram, then d.axes is a reference to its collection of axes. Valid subreferences are x and y.
Graphical user interface:
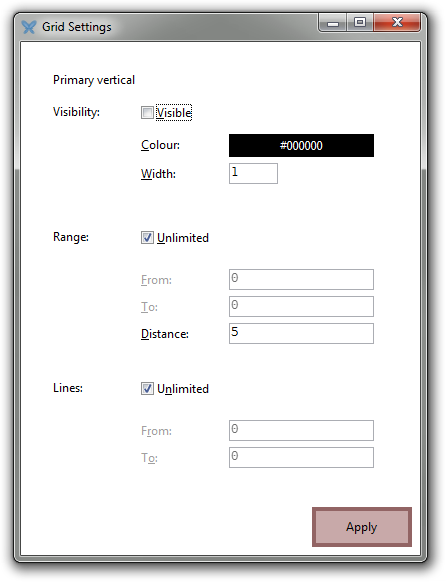
Grid line families
Each grid line family has the following properties:
-
distance: positive number -
axmin: real number -
axmax: real number -
line start: real number -
line end: real number -
visible: boolean -
width: positive integer -
color: colour
If d is a reference to a diagram, then
-
d.grids.horizontal -
d.grids.horizontal2 -
d.grids.vertical -
d.grids.vertical2 -
d.grids.radial -
d.grids.radial2 -
d.grids.circular
are references to its grid lines families.
Graphical user interface:
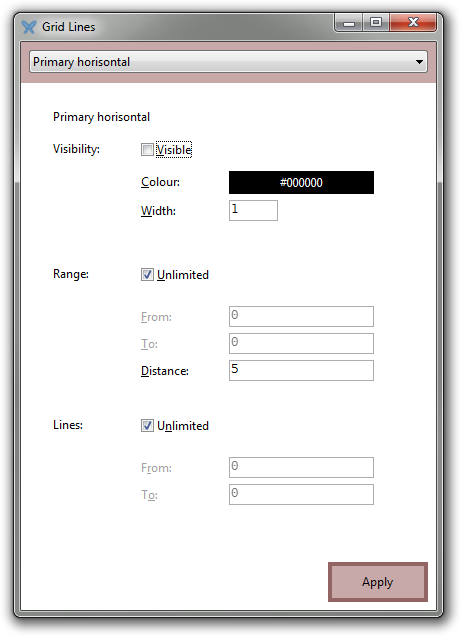
Grid line family collections
A grid line family collection has no properties of its own, but contains subreferences to the individual grid line families. If d is a reference to a diagram, then d.grids is a reference to its collection of grid line families. Valid subreferences are horizontal, horizontal2, vertical, vertical2, radial, radial2, and circular.
Graphical user interface:
Views
Each diagram has a unique view subobject that determines the bounds of the scene in space coordinates.
The view subobject has the following properties:
-
xmin: real number -
xmax: real number -
ymin: real number -
ymax: real number -
center point: 2D point
Setting the center point parameter simply adjusts the xmin, xmax, ymin, and ymax properties so that the scene becomes centred at the specified point but retains its original width and height.
If d is a reference to a diagram, then d.view is a reference to its view subobject.
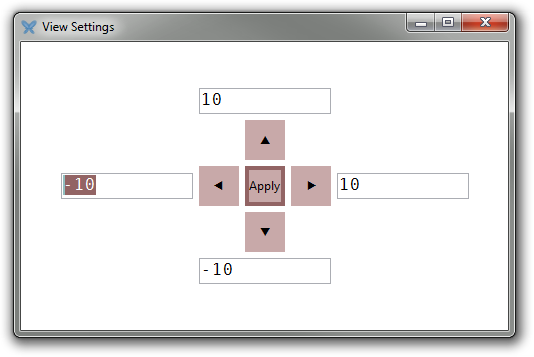
Graphical user interface:
Diagrams
A diagram has no properties of its own, but, as discussed above, contains subobjects with configurable properties (view, axes, grid lines).
Its graphical user interface combines the GUIs of its subobjects:
The screenshot above is from an empty diagram. If a diagram contains objects (charts, plots), they will also be listed to the left.
The GUI also contains a special page named “Objects” that gives an overview of the objects the diagram contains, lets you toggle the visibility of each object, remove objects, reorder them, and assign metadata properties to them:
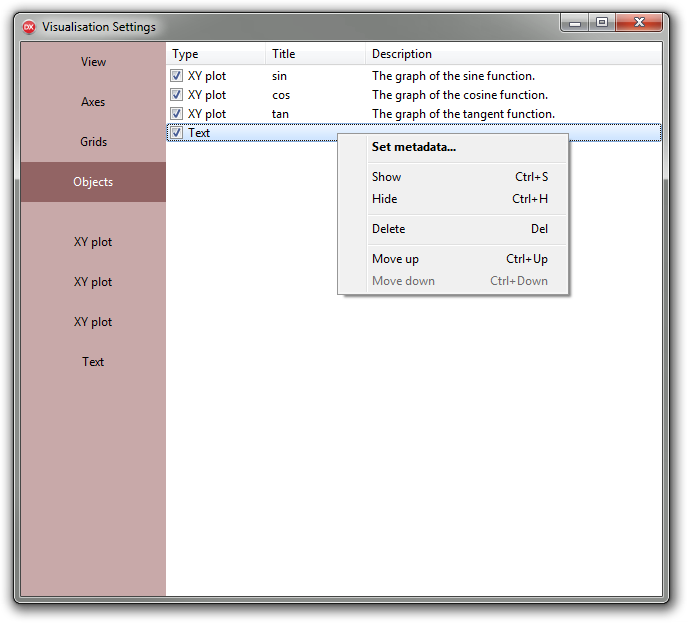
If d is a reference to a diagram, then d.objects is a reference to its object manager.
Bar charts
A bar chart has the following properties:
-
legend: boolean -
labels: boolean -
label position: real number -
value labels: boolean -
value label position: real number -
value format: string -
bar offset: real number -
bar width: real number -
bar spacing: real number
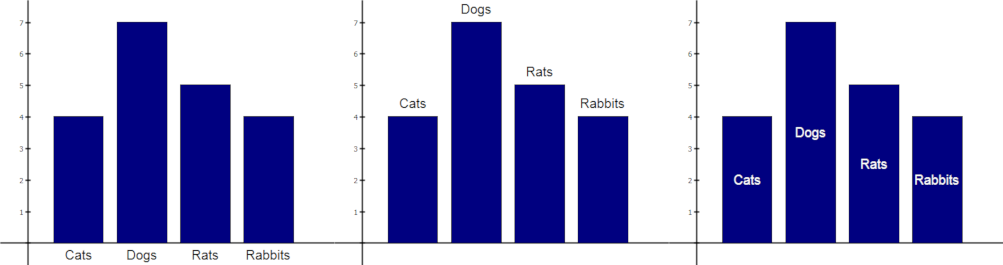
If a label position is in [0, 1], it is treated as a fraction of the bar height. If it is greater (less) than 1, it is treated as a fixed number of pixels above (below) the bar.
In the three examples below, the label positions are −8, 8, and 0.5, respectively:
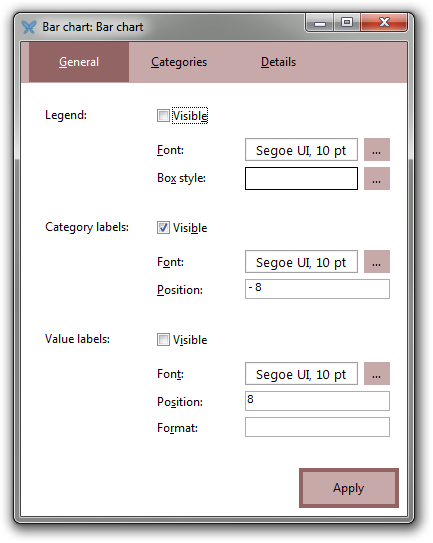
Graphical user interface:
If b is a reference to a bar chart, then d.legend is a reference to its legend. Similarly, b.Cat is a reference to the category that initially was labelled “Cat”.
Pie charts
A pie chart has the following properties:
-
legend: boolean -
labels: boolean -
label position: real number -
value labels: boolean -
value label position: real number -
value format: string -
start angle: real number -
x: real number -
y: real number -
position: 2D point -
radius: positive number
x and y are the coordinates of the centre point of the pie chart. position is the same thing but represented as a single vector.
If a label position is in [0, 1], it is treated as a fraction of the radius. If it is greater than 1, it is treated as a fixed number of pixels from the slice (radially).
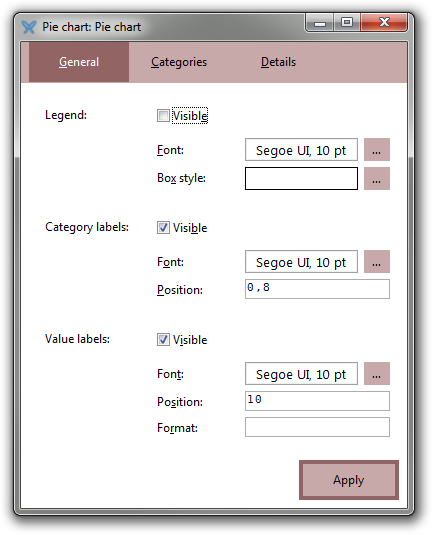
Graphical user interface:
If p is a reference to a pie chart, then p.legend is a reference to its legend. Similarly, p.Cat is a reference to the category that initially was labelled “Cat”.
Legends
If r is a reference to either a bar chart or a pie chart, then r.legend is a reference to its legend. This has the following properties:
-
line color: colour -
line width: non-negative integer -
fill color: colour -
fill opacity: real number in [0, 1]
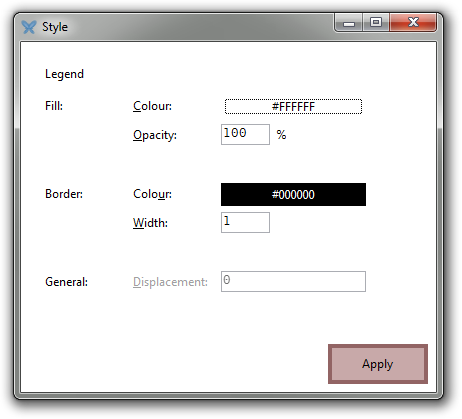
Graphical user interface:
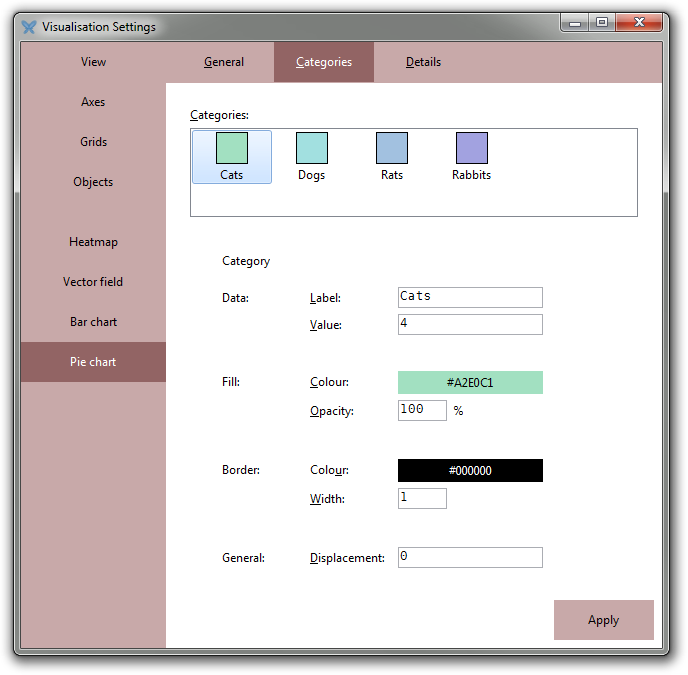
Categories
If r is a reference to either a bar chart or a pie chart, then r.Cat is a reference to the category initially labelled “Cat”. This has the following properties:
-
label: string -
value: real number -
line color: colour -
line width: non-negative integer -
fill color: colour -
fill opacity: real number in [0, 1] -
displacement: the fractional displacement of the category relative to the other categories, typically a value in [0, 1]. Currently only pie charts support such displacements.
Graphical user interface:
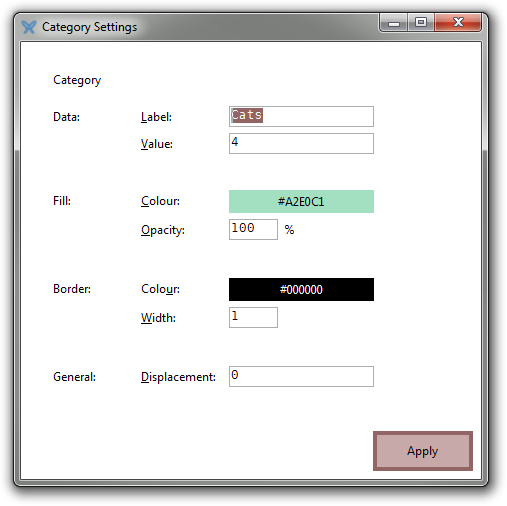
The category settings GUI can also be accessed from the parent category chart’s settings:
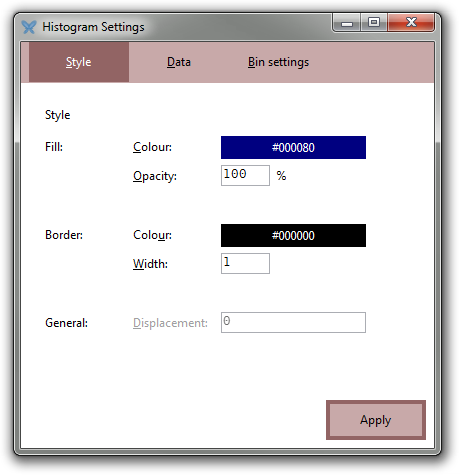
Histograms
A histogram has the following properties:
-
line color: colour -
line width: non-negative integer -
fill color: colour -
fill opacity: real number in [0, 1] -
bin width: positive number -
start at: real number
Notice that the bin width and start at parameters affect much more than the mere aesthetics of the chart.
Graphical user interface:
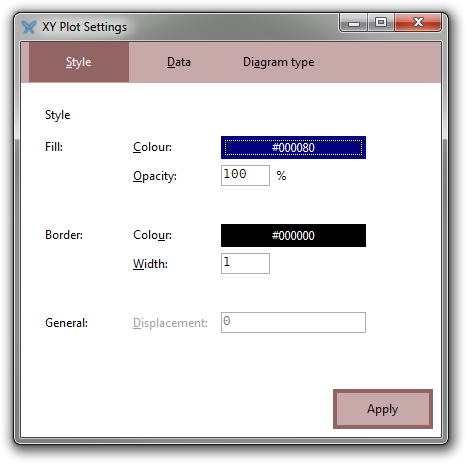
XY plots
The functions ScatterPlot, LinePlot / LineChart, AreaChart, and plot all produce XY plots, albeit with different initial settings.
An XY plot has the following properties:
-
points: boolean -
lines: boolean -
area: boolean -
point size: positive integer -
line color: colour -
line width: non-negative integer -
fill color: colour -
fill opacity: real number in [0, 1]
Initially, out of the three booleans, a scatter plot has only points set to true. Similarly, a line (area) plot has only lines (area) set to true.
Graphical user interface:
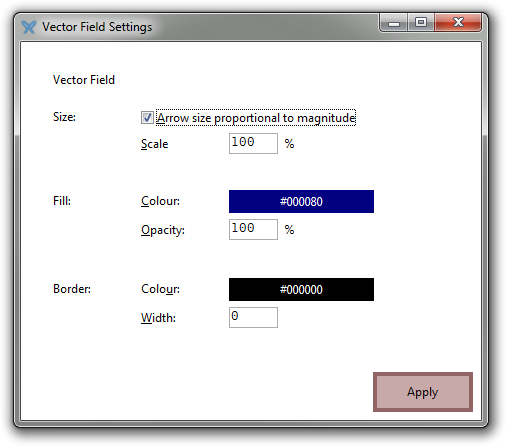
Vector fields
A vector field has the following properties:
-
arrow scale: positive real number -
use magnitude: boolean -
line color: colour -
line width: non-negative integer -
fill color: colour -
fill opacity: real number in [0, 1]
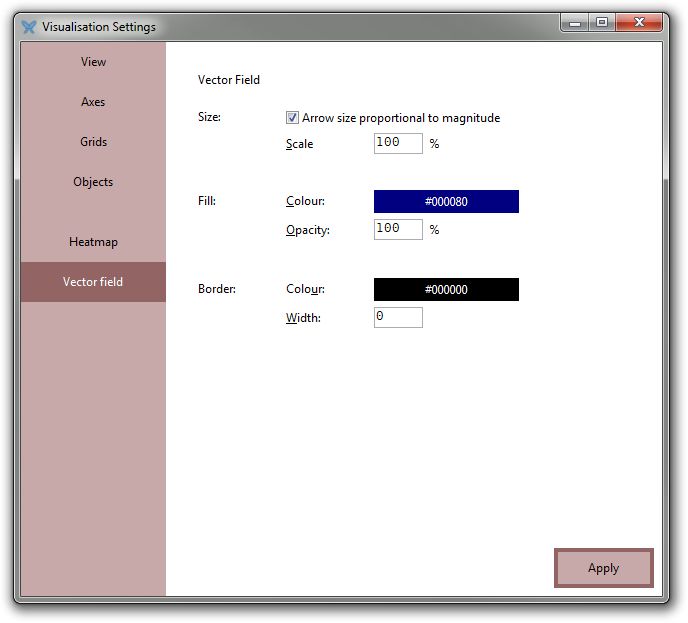
The arrows are always drawn with the direction of the vector field. If use magnitude is true, their lengths are proportional to the local magnitude of the field; otherwise, they are all drawn with the same size. arrow scale adjusts the size of all arrows by this same factor.
Graphical user interface:
Heat maps
A heat map has the following properties:
-
line color: colour -
line width: non-negative integer -
fill opacity: real number in [0, 1]
The “line” refers to the rectangular outer border of the object.
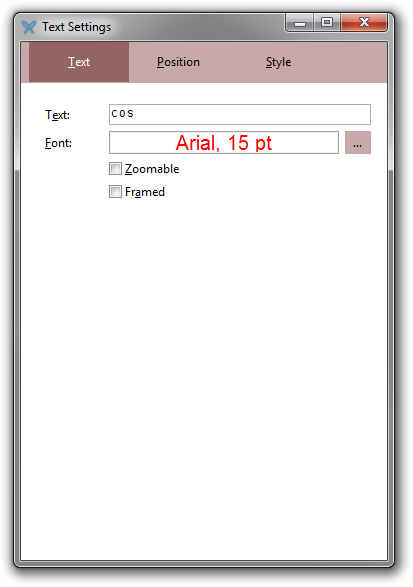
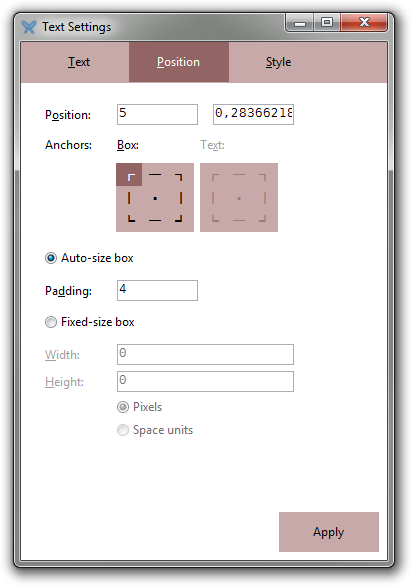
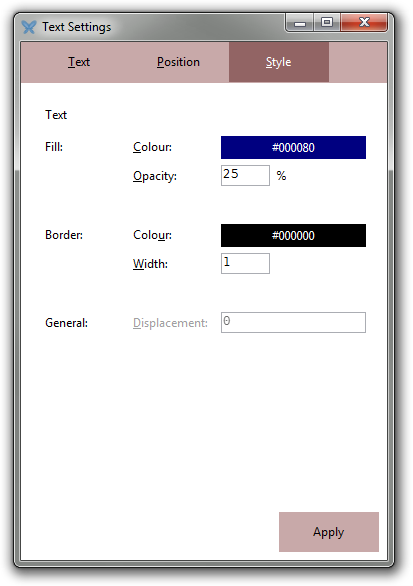
Text boxes
A text box has the following properties:
-
line color: colour -
line width: non-negative integer -
fill color: colour -
fill opacity: real number in [0, 1] -
text: string -
font name: string -
font size: positive integer -
bold: boolean -
italic: boolean -
underline: boolean -
strikethrough: boolean -
text color: colour -
boxed: boolean -
position: 2D real vector -
width: positive real number -
height: positive real number -
use rect: boolean -
anchor point: one of "top-left", "top", "top-right", "left", "center", "right", "bottom-left", "bottom", "bottom-right" -
zoom text: boolean -
zoom rect: boolean; -
alignment: one of "left", "center", "right" -
vertical alignment: one of "top", "center", "bottom" -
text anchor point: one of "top-left", "top", "top-right", "left", "center", "right", "bottom-left", "bottom", "bottom-right"
Graphical user interface:
Line segments
A line segment has the following properties:
-
start: 2D point -
end: 2D point -
line color: colour -
line width: non-negative integer
In addition, if L is a reference to a line segment, then L.start and L.end are references to its line ending objects.
Graphical user interface:
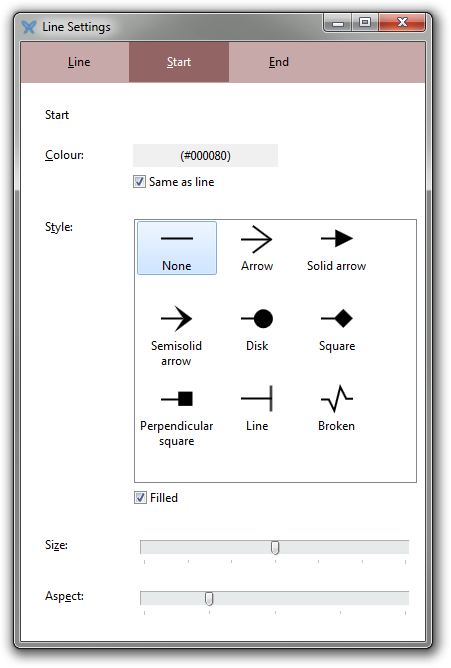
Line endings
A line ending has the following properties:
-
shape: one of "none", "line arrow", "triangle", "semiarrow", "disk", "square", "square 2", "bar", or "broken" -
filled: boolean -
size x: positive real number -
size y: positive real number -
size: positive real number -
line width: positive integer -
color: colour -
line color: boolean (use same colour as the line having this object as an ending)
If L is a reference to a line segment, then L.start and L.end are references to its line ending objects.
Rectangles
A rectangle has the following properties:
-
top: real number -
left: real number -
right: real number -
bottom: real number -
rotation: real number (angle in radians, rotation about top-left corner) -
line color: colour -
line width: non-negative integer -
fill color: colour -
fill opacity: real number in [0, 1]
Circles and disks
A circle or disk has the following properties:
-
position: 2D vector -
radius: positive real number -
line color: colour -
line width: non-negative integer -
fill color: colour -
fill opacity: real number in [0, 1]
Mathematically, the difference between a circle and a disk is that a circle is a curve while a disk is a two-dimensional region having a circle as its boundary. The difference between the circle and the disk function is that the disk function returns an object with fill opacity 100%, while the circle function returns the same kind of object but with a fill opacity of 0%.
Polygons
A polygon has the following properties:
-
vertices: list of 2D points or n×2 real matrix -
line color: colour -
line width: non-negative integer -
fill color: colour -
fill opacity: real number in [0, 1]
Pixmaps
An embedded pixmap has the following properties:
-
pixmap: pixmap -
x: real number -
y: real number -
position: 2D real vector -
width: positive real number -
height: positive real number -
line color: colour -
line width: non-negative integer -
fill opacity: real number in [0, 1]
Metadata
Every visual object has a title and a description. These may be set using the following properties:
-
title: string -
description: string
These properties are used, for instance, when diagrams are exported as SVG images.
Window size
Every visual object has two special properties, window width and window height, that, when set, alter the size of the window currently containing the object, assuming the diagram containing the object is not docked in the main IDE.
If the diagram is docked in the main IDE, it is first detached and then its new, floating, window is resized.
-
window width: integer -
window height: integer
You can also specify the size of a floating diagram window using the Window size dialog.
Every visual object also has the detached boolean property which determines if the diagram containing the object is detached (has its own window) or docked in the IDE; this only applies to named diagrams, however.
-
detached: boolean
Finally, every visual object has the auto normalize property. When set to true, the diagram containing it will be set to automatic normalization, meaning that the logical view will adapt according to the window size so that one unit in the horizontal direction will correspond to the same physical on-screen distance as one unit in the vertical direction. This normalization is automatically reapplied when the window is resized.
-
auto normalize: boolean