AdjustVisual
Adjusts the settings of a visual object (chart, diagram, plot, or geometric primitive).
Syntax
-
AdjustVisual(v[, settings])-
vis a visual reference -
settingsis a sequence of settings
-
Description
If v is a reference to a visual object and settings is a sequence of settings of the form
"name": value
then AdjustVisual(v, settings) applies the specified settings to the object referred to by v. AdjustVisual(v, settings) returns v; hence, after a reference is returned, you may perform several successive AdjustVisual(ans, ...) commands to adjust it step by step.
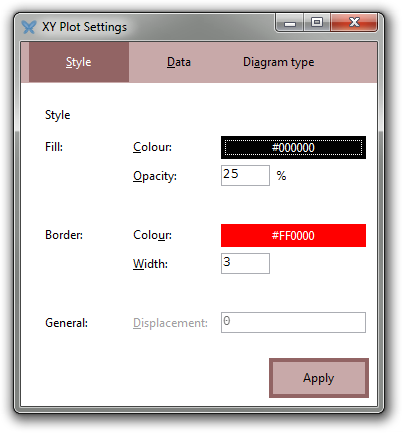
If settings is omitted, the object’s settings dialog box is shown modally and synchronously.
See Visual settings for a list of all applicable settings for each kind of visual object.
Examples
r ≔ plot(−√(1 − x^8) < y < √(1 − x^8), −1, 1, 0.0001)
AdjustVisual(r,
  "lines": true, "line color": "red", "line width": 3,
  "fill color": "red", "fill opacity": .25)
AdjustVisual(r,
  "lines": false,
  "fill color": "black", "fill opacity": .25)
AdjustVisual(r)

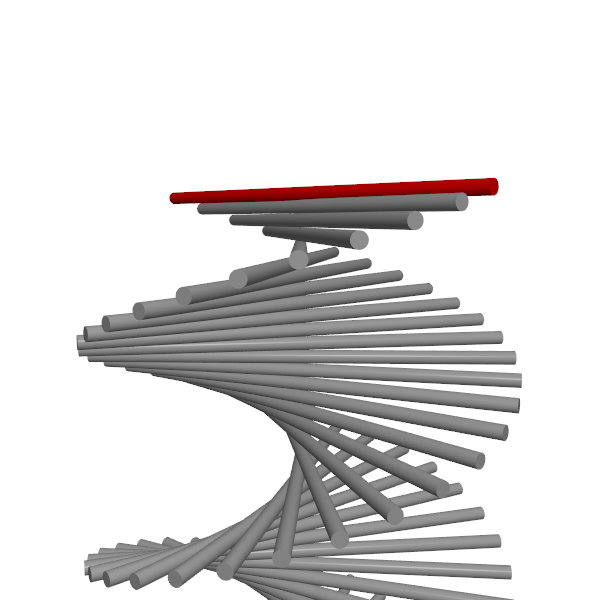
Scene ≔ ClearScene("bars");
"H ≔ surf([−π, π] × [−20, 20] @ ((u, v) ↦ ❨u⋅cos(v), u⋅sin(v), v❩))";
r ≔ v ↦ ❨−π⋅cos(v), −π⋅sin(v), v❩;
t ≔ v ↦ ❨cos(v), sin(v), 0❩;
B ≔ v ↦ solid("cylinder", r(v), ❨0.1, 0.1, 2⋅π❩, t(v));
Bars ≔ [−10, 10, 0.02] @ B;
ForEach(Bars, b, AdjustVisual(b, "visible": false));
n ≔ 1;
prev ≔ last(Bars);
ForEach(
  Bars,
  b,
  (
    AdjustVisual(prev, "visible": mod(n, 10) = 0, "color": "silver");
    prev ≔ AdjustVisual(b, "visible": true, "color": "red");
    inc(n);
    sleep(0.1)
  )
);

(animation)
See also
-
Visual settings (list)