MatrixPlot
Creates a pixmap from a real matrix.
Syntax
-
MatrixPlot(A[, c[, m[, w[, h]]]])-
Ais a real matrix -
cis a colour -
mis a boolean -
wis a positive integer -
his a positive integer
-
-
MatrixPlot(A, L[, m[, w[, h]]]])-
Ais a real matrix -
Lis a list containing two or three colours -
mis a boolean -
wis a positive integer -
his a positive integer
-
-
MatrixPlot(A, f[, m[, w[, h]]]])-
Ais a real matrix -
fis a function [0, 1] → set of colours -
mis a boolean -
wis a positive integer -
his a positive integer
-
Description
If c is a colour, then MatrixPlot(A, c, m, w, h) returns a pixmap obtained by mapping the values of A into shades of c. Specifically, a w×h pixmap consisting of same-size rectangular cells corresponding to the entries of A is returned.
If m is false, then the cell corresponding to A[i, j] is painted in the colour t⋅c where t ∈ [0, 1] is defined by t = (A[i, j] − min(A)) / (max(A) − min(A)).
If m is true, then t is instead defined by t = (A[i, j] − (−M)) / (2⋅M) where M = max(abs(A)), so that A[i, j] = 0 implies t = 0.5.
In both cases, the colour t⋅c transforms linearly from black to c as t goes from 0 to 1.
If L is a list consisting of two colours, the result of MatrixPlot(A, L, m, w, h) is the same except the colour transforms linearly from L[1] to L[2] as t varies from 0 to 1.
If L is a list consisting of three colours, the result is the same except the colour transforms linearly from L[1] to L[2] as t varies from 0 to .5 and then from L[2] to L[3] as t varies from .5 to 1.
If f is a colour-valued function defined on [0, 1], then MatrixPlot(A, f, m, w, h) will do the same thing except that f(t) will be used as the colour.
If omitted, c defaults to red, m to false, w to 200, and h to the value required to match the aspect ratio of A (given w).
Examples
A ≔ RandomIntMatrix(5, −10, 11)
⎛−5  −7  −8   0  −1⎞
⎜−6   3  −1   9   7⎟
⎜−3  −5  −8  −4  −1⎟
⎜−1   8   8  −3   9⎟
⎝10  −8   3  −7  −2⎠
MatrixPlot(A)

MatrixPlot(A, "gold")

MatrixPlot(A, '("blue", "red"), true)

MatrixPlot(A, '("blue", "white", "red"), true)

A ≔ RandomMatrix(100);
MatrixPlot(A)

MatrixPlot(A^5)

MatrixPlot(A ⋅ A*)

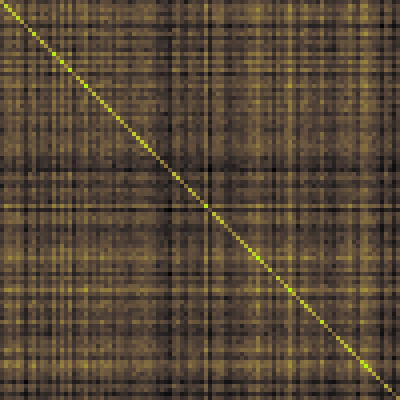
MatrixPlot(A ⋅ A*, (t ↦ hsv(80⋅t, t, t)), false, 400, 400)